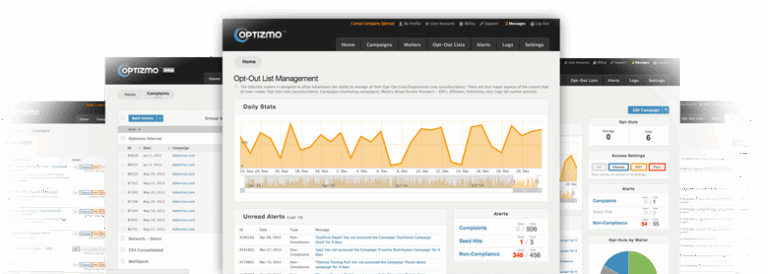
Log into just about any email platform today and you’ll find a dashboard loaded with numbers: opens, clicks, conversions, bounces, unsubscribes, spam complaints, and probably a dozen more depending on your provider. That’s a good problem to have compared to where this channel started, but it also makes it easy for new mailers to get lost staring at metrics that don’t actually tell you much. The most successful email programs are built around a handful of core numbers, tracked consistently, and understood in context. Here are five basic metrics worth putting at the center of your reporting.
1. Click-Through Rate (CTR)
Click-through rate is the metric we’d lean on most for gauging real engagement. If someone clicks, you know they saw the email and found something in it worth acting on. CTR is typically clicks divided by emails sent (or delivered, depending on how your platform does the math), and it’s a clean read on whether your subject line, preview text, and content are actually landing.
One thing worth checking: does your platform count every click, or only unique clicks per recipient? Also, is the CTR based on the total emails sent? Total delivered? Or total opened? You can track CTR based on any or all of those segments, so make sure you understand how your platform is reporting this metric before you start comparing campaigns or setting internal benchmarks.
2. Conversion Rate
Clicks are a good sign, but most campaigns exist to drive an action, a sale, a form fill, a signup, etc. There is always an ultimate success metric. Conversion rate measures the percentage of recipients who actually completed that action, and it’s the metric that ties your email performance back to the reason you sent the campaign in the first place.
A common mistake marketers make is not defining a conversion clearly before the campaign goes out. Also, are you tracking email in a silo or as part of a multi-channel marketing program? You need to define rules for how success is measured in the email channel and how activity in other channels is integrated. If someone clicked on an email and then days later visited the website and completed a purchase, does the email campaign get credit for that conversion? Nail this down in advance, or you’ll end up debating about attribution instead of learning from the results.
3. Unsubscribe Rate
Every email campaign generates opt-outs. It’s entirely normal. What matters is the rate and the pattern behind it. A sudden spike after a particular send is telling you something: maybe the content missed the mark, maybe you mailed that list too often, maybe the offer wasn’t relevant to that audience segment.
Marketers should think about unsubscribe rate as more than a compliance box to check. At OPTIZMO, we process a massive volume of opt-out requests across our client base, and the data behind those requests (when they spike, where they cluster, which campaigns generate the most) is genuinely useful for spotting audience fatigue and content problems. Consider tracking it by segment and by campaign, not just as one program-wide average, and you’ll get a lot more out of it.
Not to mention, an unsubscribe isn’t necessarily a purely negative signal. It means there’s an active inbox with someone engaging behind it. Worth thinking about.
4. Spam Complaint Rate
Spam complaints are the metric every email marketer dreads, and for good reason. When a recipient marks your email as spam instead of just unsubscribing, that’s a direct signal to their mailbox provider that your content wasn’t wanted and that they don’t remember asking for it (even if they did). Inbox providers pay close attention to this metric. A high spam complaint rate can damage your sender reputation and cause future emails to that ISP to land in the spam folder.
You want to stay well under the thresholds mailbox providers use to flag senders (Gmail and Yahoo have both gotten more specific about this in recent years). If complaints start ticking up, look at which sends or segments are driving it sooner rather than later.
5. Open Rate
Open rate wraps up this list, and that’s intentional. It’s the metric most marketers still check first out of habit, but it’s also the one most worth taking with a large grain of salt. Since Apple rolled out Mail Privacy Protection back in 2021, a large percentage of email opens are triggered automatically by Apple’s servers, prior to it even being delivered to a user’s inbox. Apple Mail is used by over 50% of email recipients, meaning that the vast majority of email campaigns will have their reported open data dramatically impacted.
So, why shouldn’t you just ignore open rates if they are so inaccurate? Open rate is still a useful piece of data, but mainly just directionally. Watch for significant changes (positive or negative) in open rates from campaign to campaign over time. A shift up or down is still relevant, and suggests your recipients are either showing higher or lower interest and engagement in at least opening your emails. That’s valuable information from a trend standpoint.
Summary
None of these five metrics tells the whole story on its own (really no single marketing metric ever does). They’re most useful when viewed holistically, tracked over time, so you can spot a pattern instead of reacting to a single number in a vacuum. Map these and other email metrics to your goals, track them consistently, and you’ll get a lot more out of your reporting than simply staring at a dashboard full of numbers ever will.
To learn more about email deployment, email compliance, and other industry insights, check out our full blog here.